Do you have an awesome product idea? Great. But do you have the vision behind your product idea? If no, then be ready to be lost on a thrilling road trip that might be leading you to new discoveries; but with no sustainable destination, you’d just wander aimlessly.
What is Product Vision?
The vision that keeps your team on track, by giving them a big picture of what they are working on & why, describing the essence of your product and keeping them from going “off the rails”. Without a clear product vision, many product teams have trouble seeing the big picture. They change course often and not clear on what to do next. Product vision provides the purpose and the motivation for developing the product (why you should care about it and excited to work on it).
Product vision is a guiding constellation that helps your team build a product strategy that is forward-looking and customer-driven, and enable teams know how to create a real value for customers. Product vision provides the North Star – that guides everyone in the organisation to move toward together to achieve their goals.
What is North Star?
One star that doesn’t move, doesn’t travel. You can find the North Star at the same place at any time of the year, and at any hour of the night in the northern hemisphere. It is the anchor of the northern sky. It is a landmark that helps those who follow it determine direction as it glows brightly to guide and lead toward a purposeful destination. For thousands of years, the North Star has been a guiding light for navigators and travellers, letting them sail the seas and cross the wilderness without getting lost.
The idea behind the North Star Metric is that if your company brings more value to your customers, then the growth of your company has to go positive.
Why you need a North Star Metric?
The North Star Metric is a product manager’s best friend. When you put it at the heart all your activities, it drives progress in following ways:
- It helps team focus on “How to move North Star metric further?” rather than “What should we build next?”
- It provides the direction and clarity on prioritization of what matters most and what not, e.g. activities, features, user stories etc.
- It gives the cross-functional alignment of goals and tasks with a singular focus.
- It focuses on impact by reflecting the product vision (growing revenue and customer value)
“Revenue” is a NOT a North Star Metric!
More revenue is the result of a growing North Star Metric, but it shouldn’t be a NSM itself. Revenue is the price that your customers pay, while your NSM is the value that your customers get back for that price. While revenue is a good indicator of how you are progressing, but customer success gives you a picture of future revenue and success. And the customer success is one of the best signals that they’ll stay as users and keep paying.
What should qualify as a ‘North Star Metric’?
NSM must do three things:
- Reflect customer value
- Lead to revenue,
- Measure progress.
Let’s look at few NSM examples:
| North Star Metric Examples | |
| Company | North Start Metric |
| Airbnb | No. of nights booked |
| DAU / MAU | |
| Amazon | No. of purchases per month |
| Spotify | Time spent listening |
| Quora | No of answers to questions |
| Uber | No. of rides per week/month |
| No. of messages sent | |
| Coinbase | Monthly Transacting users |
| Miro | No of collaborative boards |
| Tinder | Monthly active paid users |
| Netflix | No. of hours streamed |
As we see, all above mentioned NSMs are pointing to growing revenue, profit, and customer realization of value. A good North Star metric is a leading indicator of success and is tied to users getting value from a product or service. Most importantly, its helping product team focus on “What new product initiatives or features will move North Star metric further?”
How to find ‘North Star Metric’ for your product?
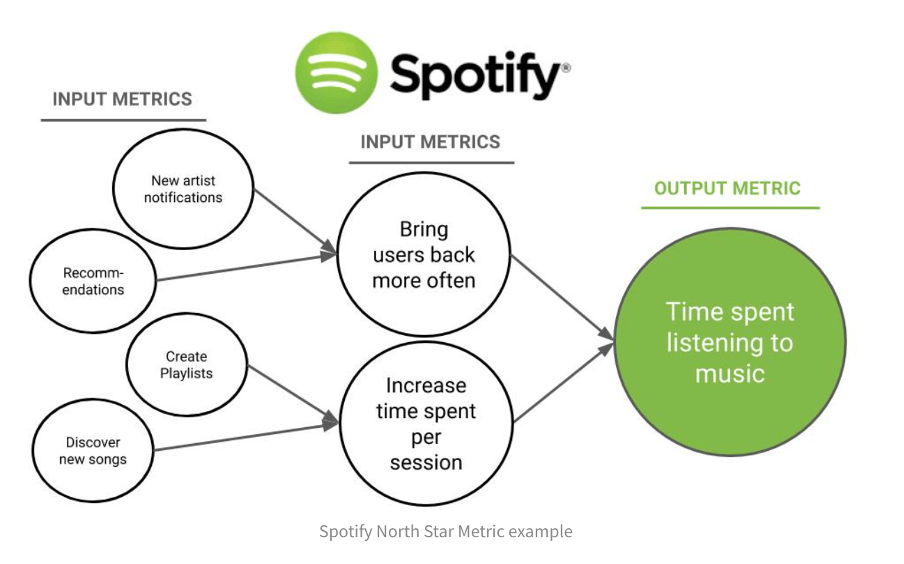
To find the North Star metric for your product, you must decide what is truly essential to the business. Let’s take an example of Spotify.
Spotify’s NSM is “Time spent listening”. What does it imply:
- Reflect customer value: ‘Time spent listening’ measures the value that customers get from the platform. It follows the funnel i.e.
- Awareness & Acquisition: Reach of customers
- Activation: Customers taking 1st important step (sign-up, sharing interests & creating 1st playlist)
- Retention: Customers keep on coming back to listen to the content.
- Lead to revenue: More the customers spend more time listening to the content, there is increase in session time, and hence monetization (ads or subscription).
- Measure progress: ‘Time spent listening’ does measure the progress as customers are building habits of listening to content as they spend time listening more frequently.
So how do you find your perfect North Star metric? Let’s take another example of Google Calendar, understand user journey and attach metrics to each step and observe the impact on user as well as company’s goals.
Google Calendar User Journey
- User gets a google account (likely for email)
- User opens calendar
- User sets a calendar item
- User invites others to calendar
- User attends meeting
| User Journey Steps | Metric | Impact on User | Impact on Company |
| User gets a google account | Awareness – % of users that know calendar is included | High | High |
| User opens the calendar | Activation – % of google account users that open the calendar 1st time | High | High |
| User opens the calendar | Engagement – Avg no. of times users open the calendar | High | High |
| User sets the calendar item | Engagement – % of users that set the calendar item per period | High | High |
| User sets the calendar item | Engagement – No. of calendar items set per period | High | High |
| User sets the calendar item | Engagement – % of time managed by Calendar | High | High |
| User invites others to calendar item or is invited | Engagement – % of meetings with RSVP (Supporting Metric) | Low | Low |
| User attends a meeting | Engagement – No of users accepting & attending the meeting. (supporting metric) | Low | Low |
The primary metrics for Google calendar is:
- % of users that open calendar
- % of users that set a calendar appointment
- Number of calendar items set per user
If you have to pick a single NorthStar metric – I think it’s the % of users that set a calendar appointment. Why?
- The action reflect the value customer gets from calendar
- Higher the number of users, higher the product adoption and retention, hence monetization opportunities
- The action shows the progress in customer growth, retention as well as product usage.
What are the steps to find the North Star Metric for you product?
Step 1: What customer problem is your product solving
This is the step where users perceive the product as a solution to their problem and understand the value your product is offering. Understanding what drives value will help you decide the relevant NSM for your business.
Step 2: What activates your customers to use the product
This is the step where customers use the product for the 1st time and experience the product’s value. The customer activation is the vital step for business as activation experience will lead to make customers further engaged and loyal.
Step 3: What product features make your customer engaged
This is the step where customers eventually get the habit of using it frequently, hence becoming the regular active users of the product. Understanding what makes your product sticky would lead to choosing a relevant North Star metric.
Step 4: Define North Star metric
Put together the core action your customers take in your product and add the necessary engagement to it. Observe the most crucial engagement that makes your product sticky. And eventually, that metric should be doing following 3 things:
- Reflect customer value,
- Lead to revenue,
- Measure progress.
How to find ‘North Star Metric’ for adtech products?
Advertising technology (or adtech) is an overarching term that describes the products advertisers use to reach audiences on publishers’ ecosystem, and deliver and measure digital advertising campaigns. In a complex digital ads ecosystem, adtech emerged to streamline the process. Adtech products provide following benefits to advertisers:
- Efficiency in campaign operations
- Better utilization of advertising spends
- Intelligence to scale further
From users perspective (who is viewing and engaging with the ad), the advertising experience should be relevant and additive, rather disruptive. Ad experience should be respectful to the end users.
So, how do we find the North Star metric for adtech products where advertisers’ goals should coincide with users’ goals. Let’s understand user journey, attach metrics to each step and observe the impact on user as well as company’s goals.
| User Journey Steps | Metric | Impact on User | Impact on Company | Does it lead to North Star Metric? |
| User sees the ad. | Awareness(Impressions) – % of users views the ad | Low | High (Brand),Low (Performance) | User might see irrelevant ad i.e. waste of impression. |
| User clicks on the ad. | Interest (Consideration) – % of users who clicks on the ad | Medium | High | Clicks just signal users’ curiosity to know further. Intent to expecation gap is unknown. |
| User further acts on ad as per advertiser goals. | Conversions (leads) – % of users who act further on the ad post 1st click | High | High | Users interest coincides with advertiser’s brand. (although scale is missing) |
| User further acts on ad as per advertiser goals | Acquisition (Cost per acquisition – CPA) – CAC | Low | Medium | Cost to a user. Quality of acquisition is also a question. |
| User transacts on brand post ad click. | Engagement(ROAS)– % of users who generate revenue to advertisers | Medium | High | Return of ad spend (ROAS) captures only the revenue part, not users’ getting value |
| User keeps transacting on brands post ad clicks. | Engagement (LTV) – % of users who continually generate revenue to advertisers | High | High | LTV captures the revenue as well as likelihood of users returning (value) |
If you have to pick a single NorthStar metric – what would that be. Conversions i.e. % of users who act further to 1st click or LTV i.e. % of users who continually coming back, engaging with ads and generating revenue to advertisers? Pls remember that NSM for Adtech should consider following:
- The action reflect the value customer gets from ads
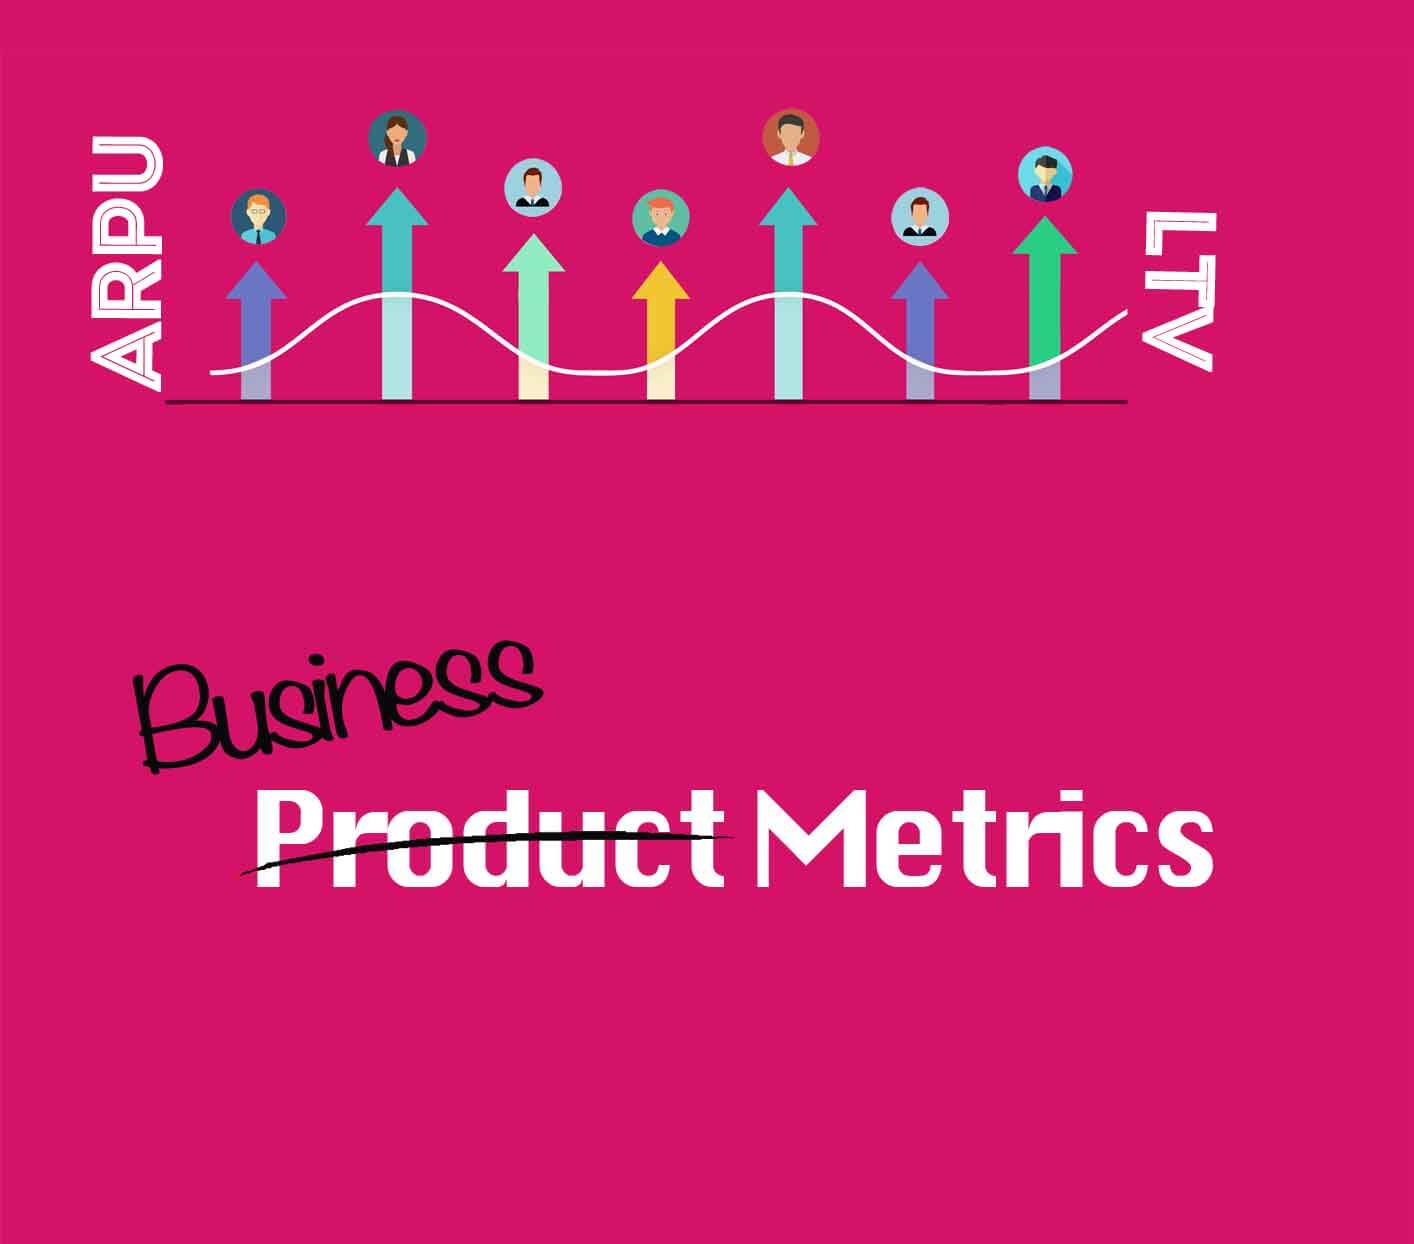
- Higher the number of users, higher the product adoption and engagement, hence better ARPU and LTV
- The action shows the progress in users growth in ads engagement, eventually leading to better revenue for advertiser as well as publisher.
What is your view on it? Please comment. 🙂
References:
“productmanagementexercises.com/4871/whats-the-north-star-metric-for-google-calendar”

 Swipe for more stories
Comments