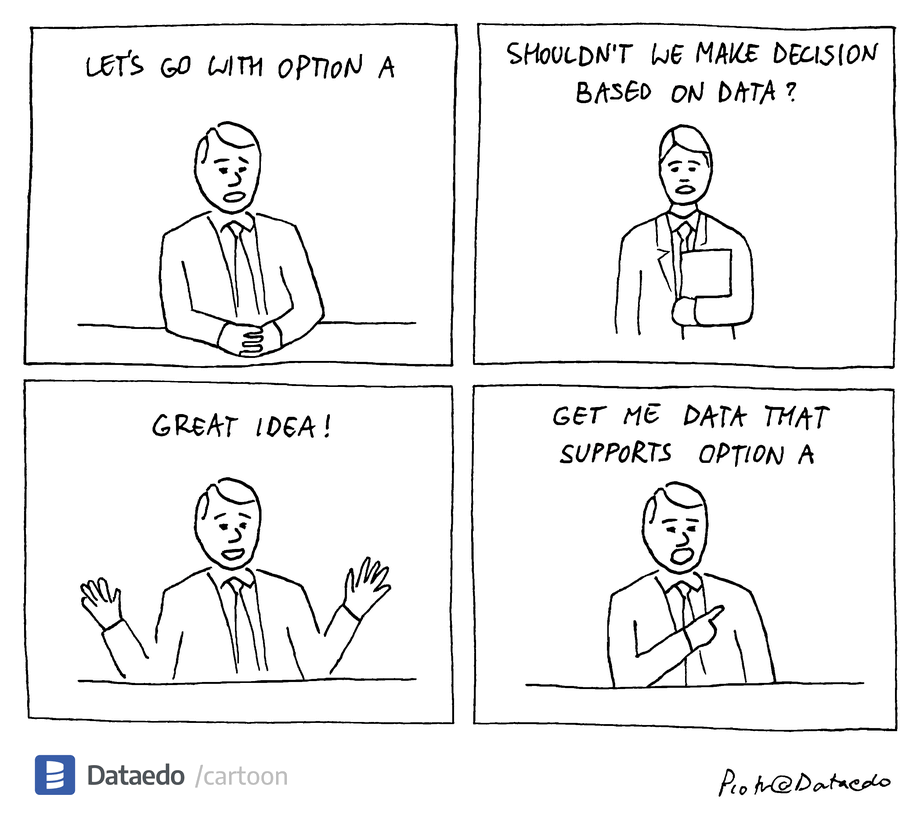
When somebody says we are a data-driven organization – how well do they know their decision-making processes are 100% data-driven (replacing the gut feeling-based decisions)? There is a huge amount of data in all organizations growing rapidly, they are constantly generating volumes of data – along with its speed, variety, and complexity. However, few are able to handle data properly, and using it for their own purpose can create real added value. Many are still struggling to turn their data into actionable insights.
With the rise of OTT and streaming services, the media and entertainment industry has truly entered the age of data. The growth of digital media consumption, the launch of direct-to-consumer services, and the advancement of advertising-based business models have made data strategically vital. Having worked in India’s one of the largest OTT company, I can see how much efforts go into building a cultural framework that helps all members of the organization to collaborate to move data at the center of decision-making. To stay ahead of our game, we are creating business-centered insights and an insights-centered business. But what does it take to enable Data literacy at every level? Before we talk about how business owners and decision-makers need to access the data and have the right mindset and competency to read insights, let’s understand the Data maturity levels of organizations. Capgemini, the world leader in the field of digital transformation consulting, published the study in 2020 on “OTT Streaming Wars: How data is reshuffling the cards in M&E industry”. The researchers identified five levels of data used by companies as follows:
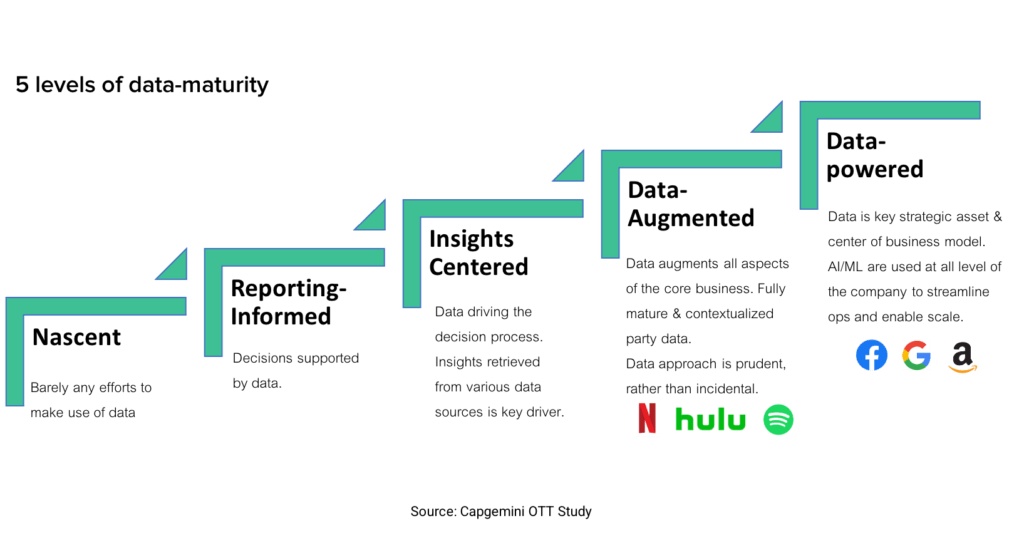
5 Levels of Data Maturity
1) Nascent: The first level is working with data mostly collected from external sources and barely any efforts to make use of data. These organizations consult mostly generic reports.
2) Reporting-Informed: Organisations collect their own data and start supporting decisions based on it. Most of the time, they compare their data with external data so as to get the maximum out of available data. As they are learning how to use the data and make decisions, they use basic reporting of data.
3) Insights-centered: At this level, organizations collect their own data, and enrich it with external data at the user level. This is where they shift their focus from the audience as a group to individual users and predict their behavior. The behavioral characteristics of each user provide much better insights to the decision-makers to decide the next steps of the organization. Many organizations are also making efforts to set up selected machine learning use cases.
4) Data-Augmented: At this level, organizations have a clear focus on what data they need to collect and how to use it. The data approach is prudent, rather than incidental. They create a fully mature & contextualized party database that is able to correlate data at different contexts. Data augment all aspects of the core business. Machine learning and automation are industrialized for control of critical processes, such as customer development platform (CDP) powering customer lifecycle management (CLM) at each customer level. Mostly successful OTT & streaming companies are lying at this level e.g. Netflix, Spotify.
5) Data-powered: These organizations have imbibed data in their culture and each and every decision is data-driven. Data is the main business and it becomes the key strategic asset, a monetizable resource & center of the business model. Data & machine learning are used at all levels of the company to streamline operations, automate decisions and enable efficient scaling. To make larger decisions, data & machine learning are used to complement human insight for the best combination. Google, Facebook, Amazon are examples of respected data-powered companies.
Transforming data to metrics (feedback)
Metrics are the feedback to the organization that enables them to distinguish the subjective from the objective and make the next decisions based on data. Metrics, as feedback, tells about how successful an organization has been on its path to success. Each organization defines its own metrics as per its products, target audience, algorithms logic, etc. There are 2 important things an organization needs to measure while defining its path to data-driven:
1) What habits they have formed (is the organization culturally data-driven)?
2) How are they making their decisions (at the strategic level)?
Decision-makers & business owners need to have access to the data and be informed on the business-centered insights. Data users must have a shared understanding of data interpretation via dashboards that should inform them on:
- What’s important?
- What do I do next?
- How do I do it?
When decision-makers become habitual to checking the dashboard on the daily basis, the data-driven culture is being established. Decision metrics also help an organization to keep the eventual goal in mind, so as to better create the processes and build better products. The direction of being data-driven is set by the technology giants who have put data, analytics, and AI at the core of their business and operational models. Facebook, Google & Amazon are the main players today, equally competitive in end-user attention.
Challenges in the direction of being Data-driven
The intention is clear but what are the key reasons for the struggle for many organizations that are not able to derive real value out of their data:
- Lack of clear vision and culture around data and insights.
- Difficulty to main data availability and quality.
- Insufficient level of teams’ autonomy and accessibility regarding data and analytics.
- Difficulty to deal with privacy and regulation compliance while ensuring the trustful image.
How can they overcome the challenges:
1. Set data at the strategy core across the full CxO suite.
Usage, use case detection, and data generation must be central KPIs for all business owners. For intuition-driven decisions to be made (at certain levels), data should inform the intuition. The data-insight team should arm decision-makers around the company with useful metrics, insights, predictions, and analytics tools so that everyone can be stellar in their functions.
2. Environment of trust and integrate it into the brand promise.
Focus on customer value proposition, giving control to end-users over their data. Leverage data as a competitive advantage and solve the privacy versus personalization dilemma, building the trust and confidence of partners and advertisers. Customer trust in the goodwill of platforms.
“People want hyper-personalized experiences but don’t want to give away any personal data – this is a new paradigm for the industry”
3. Address users, not audiences
Segments are too abstract and simplified. To reach the required level of personalization and targetability, organizations must understand their customers on a user level, instead of an aggregated audience level. For this to happen, organizations should include as much data as possible, from internal and external (data enrichment), and through optimization about user levels. The data should go beyond segmentation and delve into individual levels that build holistic views about the users.
4. Work on culture and skill to close the gap between business and data.
Create business-centered insights and an insights-centered business. To ensure data-driven decision-making is enabled throughout the organization, business owners need to access the data and have the right mindset and competency to read insights. Make data available to the right teams internally, and ensure what the data actually means. Clear guidance must be provided through the organization and data users must have a shared understanding of data interpretation. Show the holes in data collection and inaccuracies all around. 1st focus should always be on data quality, its completeness, & validity. The volume and speed of data have accelerated so much that they are easy to forget.
5. Build data-in-motion cloud-basedarchitecture.
Build an event-based architecture for real-time processing of data and trigger immediate business actions. This enables the timely action, flexibility, ease of access, and advanced capabilities provided by cloud platform vendors.
6. Become algorithms-centered
Set algorithmic decisions at the core of your company to stay ahead of the game in every business area. Gather information from many sources of interaction and data, transform them into insights, and decide to act upon them, any time, any place, and in real-time, while delegating to human beings only when necessary. For example, Netflix, Youtube, Hulu use personalized content & ad recommender and NLPs with different algorithmic approaches including causal modeling, reinforcement learning, neural networks, etc.
7. Align data governance to enable democratization and agility
Insights and algorithms can contribute to value creation only if data can be trusted and accessed. E.g., if the age/gender data of the audience is corrupted, other insights can’t be trusted. This requires strong governance to ensure data stays accurate, reliable, and protected. For example, Netflix adopted a data-ops approach designed to provide secured and automatic self-service access to data scientists to rapidly develop and deploy data-intensive applications for its data completion and recommendation engine.
Dashboards dependency
How do we ensure the top management is well-versed with key data, its insights, and recommendations – dashboards. It’s the data science and analysis team that has the access to whole data and hence, has the onus to inform the top management via dashboards. Problem – due to the nature of the roles of data analysts, they usually throw the complete data up on dashboards. Consequently, top management is not able to take action as a) they don’t understand data b) they don’t have time to go through big data. How do we ensure the data summary to be shown to top management so that they can take action?
The primary purpose of the dashboard is – to drive action. To make smart decisions from the data summary shown in the dashboard, it should include
– What has happened (important KPIs to whoever is viewing the dashboard)
– What are the insights and next steps for viewers to take.
– Recommendations of how to take the next steps.
References:
Capgemini OTT Study 2020
genpact.com/insight/point-of-view/the-future-of-decision-making-augmented-intelligence
 Swipe for more stories
Comments