The key to success in any endeavor is measurement. We need to set KPIs/metrics and measure the events in order to have a clear picture of what’s working and what isn’t. Metrics are nothing but quantifiable numbers that tell you important information about a product or process under question. Each metric tells a unique story, but no single metric can tell us the whole story on its own. In today’s digital world, many of us are measuring anything and everything to build a successful story of the product, but eventually struggling to discover the true value of vanity metrics to a business.
What are Vanity Metrics?
Whether the information provided by the KPIs we’re going to measure going to give us any useful insights into ways to improve your bottom line? If not, it’s likely a vanity metric. E.g. “likes”, “shares”, “impressions”, “CTR”, “views” etc. These metrics are the actions/events done by users, leading them to a certain desired direction, but many times these actions are incidental. Vanity metrics are non-transactional metrics that tell us about certain behavior of the users but not the impact on business. For performance marketers especially, for whom the time is money and getting insights out of the real-time data is crucial, they are seeking to focus on only metrics which are going to impact the revenue eventually. Performance marketers usually choose to measure the event where customers choose to pay, in order to measure the revenue impact of it and ignore the other preceding metrics as it gives no conversion value to them. On the other hand, ‘lifetime value’ is the metric for them with the utmost importance.
Do Vanity Metrics have any value?
Each metric is giving us a feedback on specific user event in his complete journey. It’s not a complete story though. Metrics such as impressions, “likes” etc are not useless, quite the contrary. For example, “Impressions” and “Clicks” are telling us the top-of-the-funnel visibility & reach of the users. Whereas, “CTR” gives clicks and impressions a whole new dimension – key indicators of ad efficiency. Similarly, “DAU” or “MAU” is the daily/monthly active users on the product, but these numbers don’t tell us how many people repeatedly visit and the engagement levels of the users.
The purpose of vanity metrics are:
- To measure the non-transactional goals e.g. brand awareness, sentiments etc
- To help optimization of product workflow
- To have better understanding of users movement/journey
How do we measure the overall success of a product then?
Product success metrics are the key indicators based on which the business performance is measured. The real objective of the product is to get the user to perform all the desired events on the product and lead him to pay/purchase, which eventually converts into business revenue. Lets us try to understand the Product success metrics in the following 2 key parameters:
1) Metrics to maintain the product performance (product penetration/ reach of users)
2) Metrics to learn about users (user stickiness)
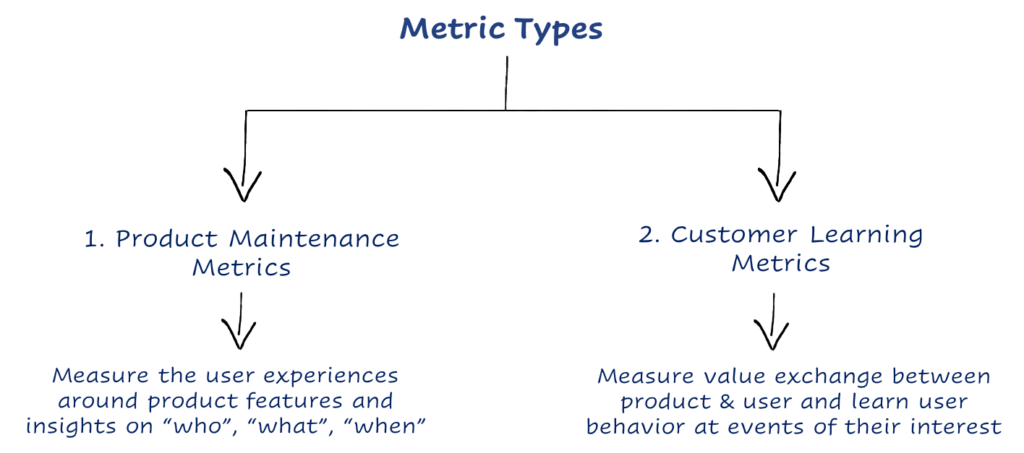
1) Metrics to maintain the product performance:
These are the metrics to manage the product and conforming to the presence of product features and decide benchmarks for the successful events around the features. These metrics tell us the performance of product desired features in terms of “who”, “what”, “when”, e.g. “likes”, “shares” measures the user engagement, “DAU”, “MAU” measure the active users, “Impressions”, “clicks” measure the reach and curiosity of users in the digital advertising world.
To answer the question – “What metrics are most commonly used to make decisions that drive actual actions every week/month?”, we take the proportional metrics to spot patterns and value, e.g. CTR to measure the ad efficiency, DAU/MAU to measure the repeated visits, etc. Savvy product guys quite often mix the ads metrics with content viewing metrics, e.g. “Impressions/ DAU” or “clicks / DAU” which gives insights into ads effectiveness on certain media.
2) Metrics to learn about users:
Problem – The net purpose of the above metric system is that we often opt for running a feature factory and choose to improve those.
Solution – To learn the value exchange between user and product.
From events around product desired features, we intend to measure the funnel of users – how many users are turning from top-to-middle-to-bottom of the funnel and leading to business revenue. Or put simply, we measure the users’ behavior as per the goals/objectives. Many times, users behave in a way we never intended but give us the direction of their interest or intent. This is where we need to learn about users’ behavior they are interested in and design the product workflow accordingly. This new behavior can be situational, contextual, emotion-based, or based on any other specific need from the product.
For example – On Strava – an app for fitness lovers, one data tells us that users are not only interested in measuring their time records and comparing performance with others, but also interested in reaching to the like-minded communities for further inspiration, so that they can step up their game.
So, we are trying to learn about users’ new behavior and trying to understand “what’s next” in the product. Following 3 key things we try to learn:
- How are users spending their time using the product and engaging with it
- How are they making decisions of their life using the product and showing what specific interest
- How are they progressing and what habits are they forming.
Once we learn the user behavior from their progression point of view, we will be able to improve and design the product better, as needed by its users. Eventually, leading to the profitability of the company.
How do we make the metrics impactful to the bottom line?
To understand whether we have converted our audience, whether they are going to stick around – let’s look at the Impact Matrix created by Avinash Kaushik. <LINK>) Avinash has beautifully painted a simple picture of the big, complicated world of analytics into a 2×2 matrix.
The matrix looks like as follows:
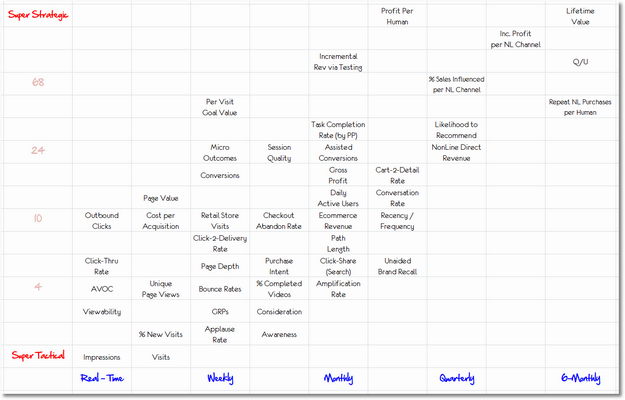
On the X-axis, we see ‘time-to-usefulness’ for each metric. On the Y-axis, we see the ‘strategic value of the metric’ to the business. Its Y-axis is exponential scale – that tells that impact is not a step-change.
We see a list of metrics shown on the graph. Avinash has taken the examples of digital as well as offline metrics (retail & brands specific), but let us try to understand this with digital metrics only.
For example, “Impressions” can be used in real-time for decision-making by our ad platforms. You can tie this with revenue in real-time, but doing so is almost entirely useless. It should be deeply analyzed monthly to yield valuable, higher impact actionable insights. Finally, “Lifetime Value” will require perhaps the toughest strategic analysis, from data accumulated over months, and the action takes time to yield results. It’s not based on a single metric but is the result of many different factors coming together over a long period of time.
In nutshell, vanity metrics are not really vanity metrics, it takes time to be valuable. For example, “Profit per human” (PPH) is a more strategic metric than “Repeat purchases per human” (RPPH), as shown in the Impact matrix chart, but time-to-be-valuable for PPH is shorter (3 months) than it is for RPPH (6 months). The whole objective is to use each metric (super tactical like “impressions”) measured on a real-time basis and reach to super-strategic metric e.g. “LTV”, and define how users get converted and contribute to the bottom-line. These are the metrics that facilitate deeper analysis to deliver a big bottom-line impact. We do that by beginning with product goals, concretizing that with actionable metrics to conform and metrics to learn the user behavior, and then breaking those behaviors down into goals that can be measured by metrics like the ones I share above.
Vanity Metrics attribution to Bottom-funnel metrics: Conversion probability
Holy grail. The new metric is born. 🙂
As we see above, there are metrics that inform us on users’ real-time performance – giving us the feedback that we are on the right track. And there are metrics that enable us to learn from their behavior – to perform future modifications so as to have better performance i.e. retain users and engage better. Vanity metrics can be sometimes, neglected as we don’t see their impact on bottom-funnel metrics i.e. conversions.
Through conversion probability, we can understand the impact of vanity metrics on product performance, which can lead us to
– improve our products in the direction of user-behavior
– develop new products as per the identification of opportunities
References:
kaushik.net/avinash/impact-matrix-digital-analytics-framework
 Swipe for more stories
Comments