How valuable is your company? Revenue rich but profit poor?
In data-driven companies (especially Saas-based), we mostly hear the product performance narratives are around business performance, i.e. revenue achieved, user growth, and profitability. While business is always measured from revenue and user growth, the metrics to understand the overall health of product growth are different.
The value of the product is subjective.
Different users have their own way to evaluate the product’s effectiveness depending on the context, task, and personal characteristics. E.g., when is the product used, how is it used, under what situations, environment, etc. It is not only the effectiveness of the product that wins the market but the product’s added value, i.e. how well the task (job-to-be-done) is done for which the product is used in comparison to the alternatives.If the product creates added value relative to the current way of solving the problem and the added value is enough to overcome the inertia, then they will choose your product to solve their problems.
How do we assess the added value of a product? (efficiency vs effectiveness)
Measuring product effectiveness (how successfully the task is done) and efficiency (added value in comparison to alternatives) is a fundamental part to gauge product efficaciousness. But to understand the product’s overall health and viability to navigate the market, let’s first understand the types of metrics:
a) Product metrics – how users use the product and get converted into active users/ paying users etc. E.g. user activation, engagement, retention, LTV, etc.
b) Growth Metrics – how business is built around the product. E.g. DAU/MAU, business revenue, ARPU, etc.
To determine the product usage effectiveness of solving the “job-to-be-done”, we need to look at how users solve their problems, with what amount of effort and resources are needed, and achieve certain progress. Once we gauge the progress, we can look at the added-value metrics by looking at the difference in the efficiency metrics of existing solutions.

As we see, growth metrics are derived from product metrics and the influx of new users. It is the product metrics, which are about product usage, leading to the eventual business output i.e. user growth, revenue, profit, etc.
E.g. DAU (growth metric) = New users x Daily retention (product metric)
Growth metrics are what we plan to scale, which happens with the increase of the product metrics and new users. When we talk about scale, we talk about the “unit” in unit economics which is to be scaled. So, it is always the “unit” that we plan to scale.
“Unit” is what we plan to scale.
Unit Economics
Unit economics answers a simple question – do we make money on a particular unit (user) or not. A “Unit” is the fundamental minimum piece of your business that you can measure to understand where your revenue comes from.
A unit can be
- A new user (e.g. app business),
- A paying/subscribed user (e.g. Saas business),
- A product itself (e.g. car for car dealership business) etc
Why use unit economics?
In the context of product development, unit economics is one of the product management metrics, where a product manager can strip your business model down to the bare minimum of “one unit”, and demonstrate to create a better business model that not only improves your bottom line but also fuels profitable growth. Taking a unit economics approach helps you ensure that you’re steering your company in the right direction and that your product is following its success route.
When to apply unit economics?
1. To identify the inconsistencies between product growth and business growth – Unit economics helps us understand the blockers to achieve profitability.
2. To assess the product potential –Unit economics help us understand the product status quo and predict its future development, eventually leading to an increase and retention of its user base.
3. To analyze business performance – Unit economics helps us understand the product-market fit, product’s sustainability in the market, predict the customer conversion rates, and eventually the profitability.
Decomposition of ‘unit economics’ into ARPU and LTV
Metrics are typically tied to key events in a user’s lifecycle in a product. And user’s journey is usually tracked through a product in terms of
(a) engagement (activation -> stickiness -> retention), and
(b) monetization (activation -> purchase -> repurchase).
Both engagement and monetization metrics affect the LTV, whereas only monetization metrics affect the ARPU. Let’s further decompose ARPU & LTV, and understand its applicability.
ARPU
Average Revenue per User (ARPU) is a computation of the Average Revenue earned by a customer over a certain period of time.
Example – ARPU:
Let’s say you have an app where users can purchase something. Let’s take the period of time as three months.
- Total no of active users last 3 months: 100,000
- Total no of purchases made in last 3 months: 10,000
- Total revenue generated summing all purchases in 3 months: $100,000
- ARPU / month = Total revenue generated / Total no of active users = 100,000 / 100,000 = $1
- ARPU (for paying user) / month = Total revenue generated / Total no of paying users = 100,000 / 10,000 = $10
–
ARPU applicability:
ARPU is suited for understanding how you monetize your active audience, what happens to monetization over long periods of time, and how the purchasing power of different user segments differs. ARPU has a practical meaning as this metric is suitable for analyzing product establishment with a large and stable active audience.
LTV
Lifetime Customer Value (LTV) is calculated based on contribution margin, i.e. the difference between revenue and all variable costs that are directly associated with the product sold. In Saas business, LTV is the amount we make from users from the time they sign up, to the time they cancel and don’t return.
Why contribution margin? Because it tells us what will happen when we scale the business. LTV is looking at past user behavior and predicts future behavior.
LTV = ARPU x (1/Churn) / CAC
ARPU = Average revenue per user for the period of time.
(1/Churn) = Percentage of users that are retained (retention rate).
CAC = Cost to acquire 1 user.
Example – LTV:
Let’s take the same above-mentioned example where users can purchase something inside the app. Let’s take the period of time as 3 months.
ARPU (for paying users): $10
Let’s assume 40% of the users leave the app post 3 months. Hence the percentage of users that are retained is
Retention rate = (1/Churn) = (1/40%) = 2.5
CAC (assume) = $1
LTV = ($10 x 2.5) / 1 = $25
–
Cohort Analysis:
LTV calculation greatly varies for different companies, based on the nature of business and types of customers. Quite often, it makes sense to segment the customers into certain groups – cohorts – based on the time of their 1st sign-up / purchase, etc.
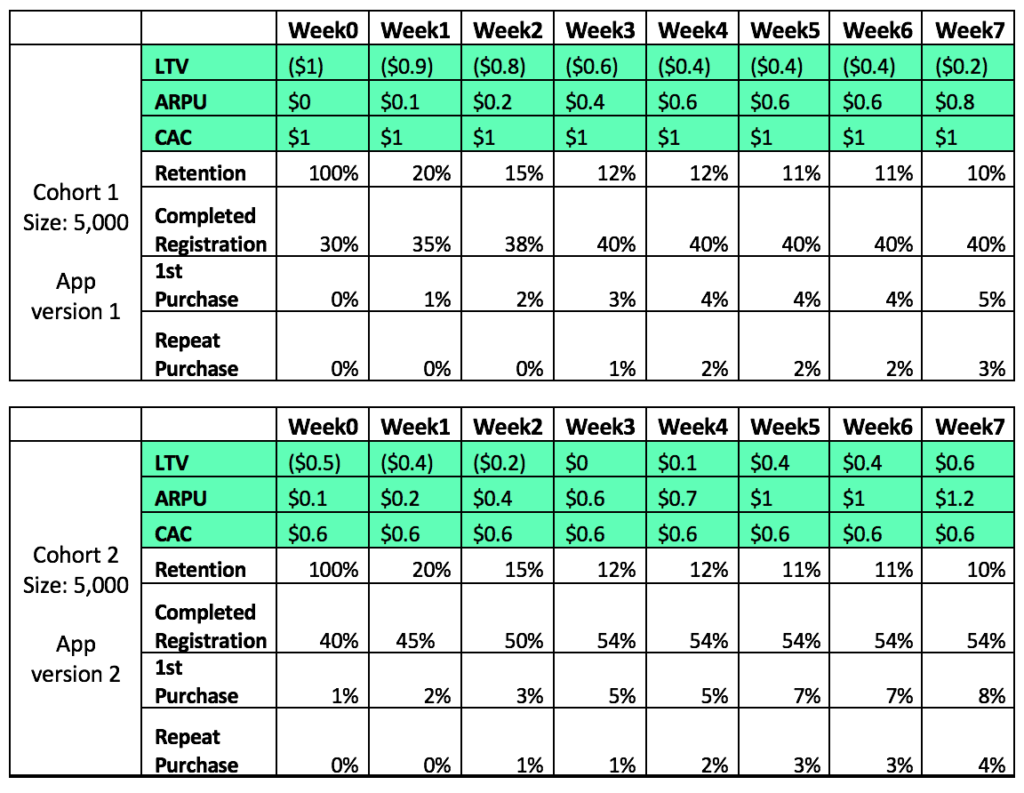
Example – LTV based on Cohort Analysis:
Let’s assume we have 5,000 users (Cohort 1) who came to 1st version of the app. At the end of week 0, 30% completed registration and no one made any purchase. At the end of week 1, 5% more users registered themselves (total registered users become 35%), and 1% made their 1st purchase (let’s assume the average ticket value is $5). And so on.
Similarly, next Cohort 2 of size 5000 users who came to 2nd version of the app. As we see, we improved on completed registration and purchases, eventually increasing the LTV.
LTV Applicability:
Cohort analysis to calculate the LTV informs us about the product’s health, what is working and what is not. With LTV, we are able to track the success of job-to-be-done (tasks) by users in the app (engagement), remove blockers and increase the conversions/purchases (monetization).
LTV is a product metric that helps you look into the future by predicting the actions of users and forecasting how your users are likely to behave in the future.
How to optimize the LTV
1. Evaluate your pricing models – Pricing plays an important role in bringing the revenue in. Experimentation with pricing is needed to figure out the factors that can increase the conversion of more users into paying customers.
2. Focus on customer retention – Starting from users’ onboarding process (welcoming the users) to their 1st purchase and repeat purchases, customer delight is the key to making them stick to your product – enabling high LTV and revenue.
3. Optimize User acquisition channels – If you’re spending money to acquire users, analyze the users who churn out quickly and the channels from which they have been acquired. Invest in channels that result in lower CAC.
Lifetime Value Amplifications
LTV is a high-level metric. It helps us understand consumption, retention as well as transaction behavior. It also measures how many times a user is returning to the product. This tells us 2 things:
1) User believes in the value of the product/content.
2) The overall lifetime amplification rate i.e. how current users are amplifying the product to the new users (through liking or sharing)
Relying on unit economics, we can understand what customers love more, thus keeping up to sustainability standards, and creating a better business model that not only improves your bottom line but also fuels profitability.
image source: convert2x.com


 Swipe for more stories
Comments