“What gets measured gets done.”
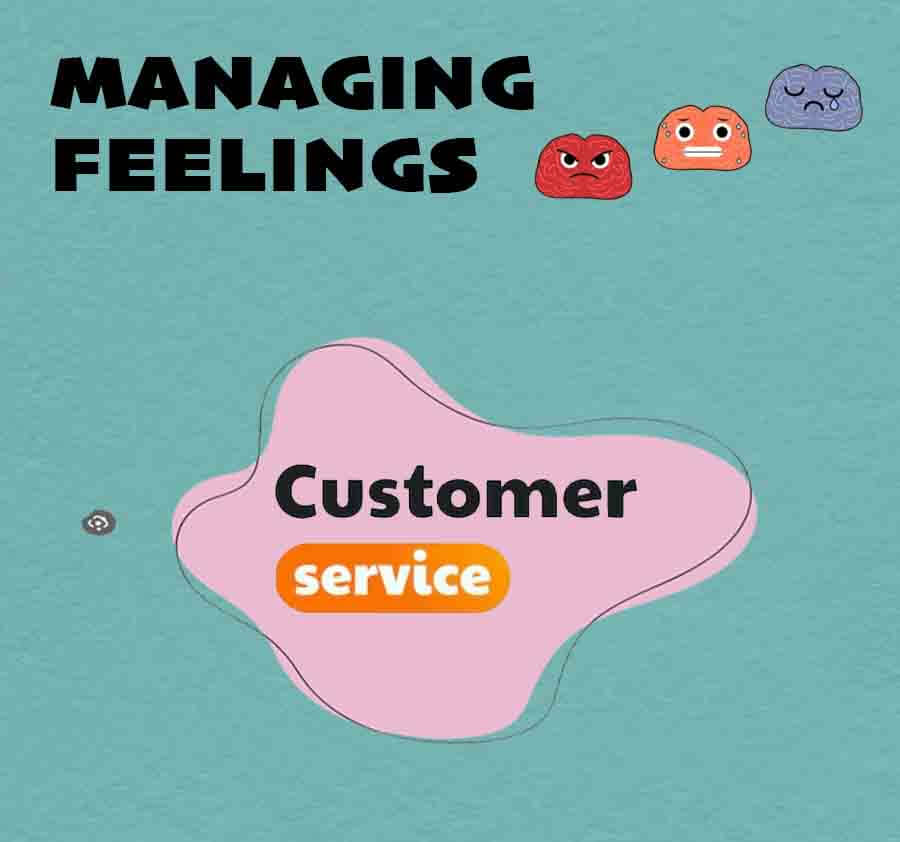
But we need to make sure the right work gets done. How do we define right work? A sequence of events that we care about.
What comes first – Workflows or Goals?
In product development, identifying events that users care about, is the most crucial task to the product development community so as to define the success of product launch in the market. To measure events that we care about, we typically add code to our existing code, and that code records the event along with additional context. We then combine these measures together to drive metrics. Or do we identify metrics 1st and measure events later?
Let’s look at the fundamentals and origins of measures and metrics (and KPIs) so that we can design the workflows better and set the goals properly.
Measurement:
A measurement is a data point at a single point in time. Measures are simply the numbers or values, such as sales, clicks, distances, etc. The term is often used alongside dimensions, which are used to filter out the measures further.
Metrics:
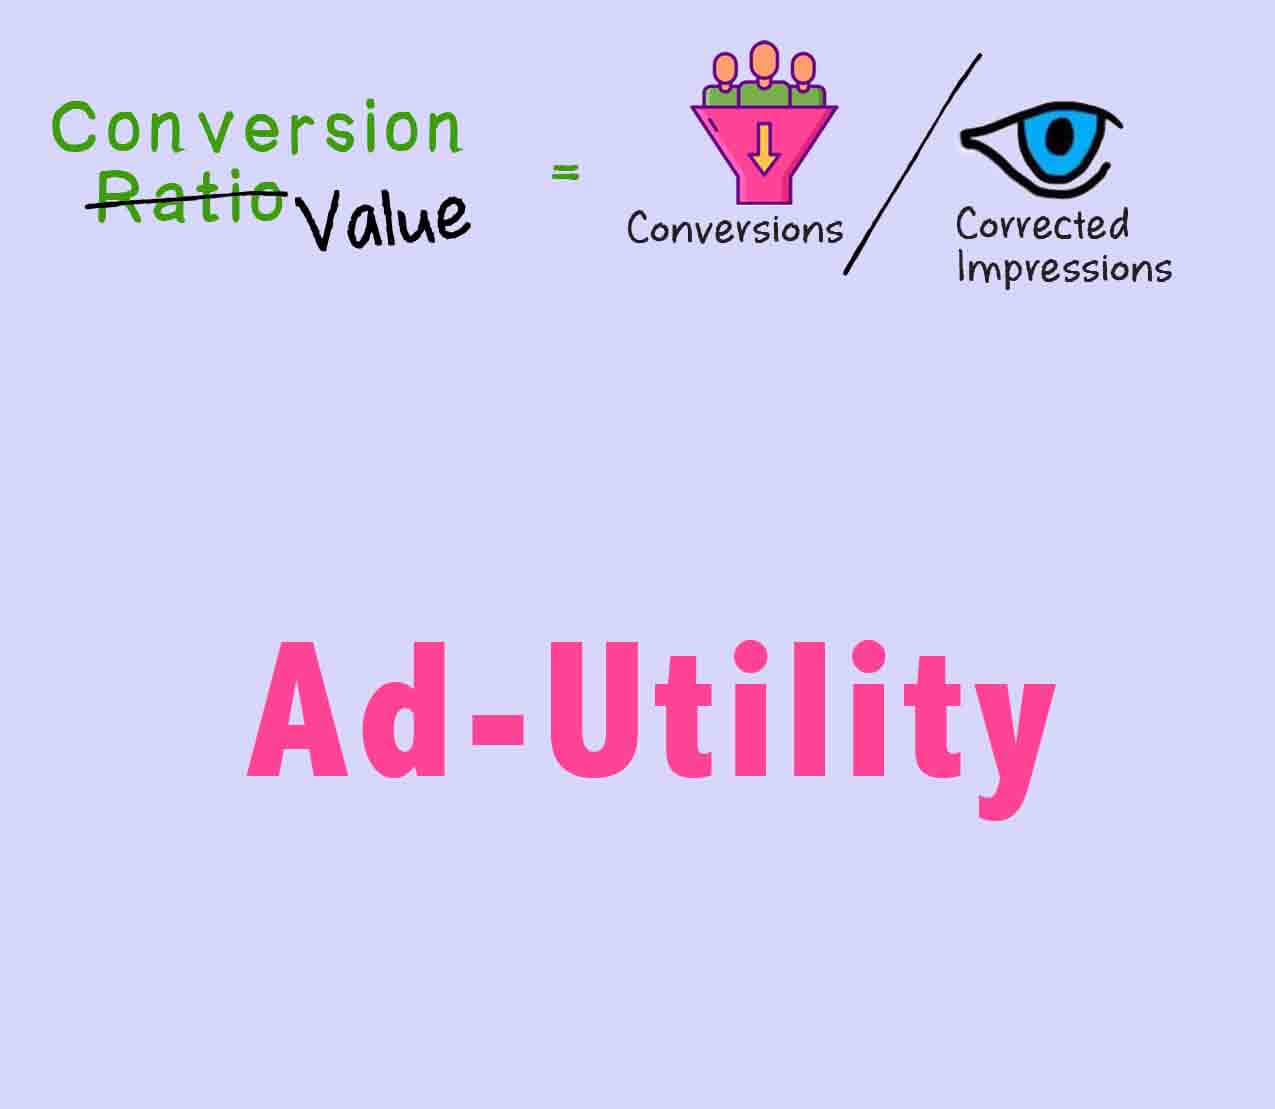
A metric is a data point in context. It is the calculation between two measures. They are used to track specific processes, such as the conversion rate of advertising, etc.
Difference between Measurement & Metric:
Measurement is unit-specific. The value of measures is the results of the activities or just the raw data classification. For example – total number of clicks, number of sales, height, color, etc. Measures are a fundamental unit that in and of itself provides very little information. It is, in itself, out of context.
For example, if we say a person traveled 50kms, all we can say is the distance he traveled. We don’t know if it is fast or slow.
Metric is the data-point (measurement) in context. It enables businesses to assess the performance of their processes. In short, a metric is a measure with an additional data point. For example – click-through rate, speed, etc.
To use our above example of distance traveled, with just the measure (KMS) you can only tell how far a person has traveled. By factoring in the time, you can tell how far he traveled, how long it took him, and how fast he was going.
Metrics bring together measures with other data points to make them tell a story.
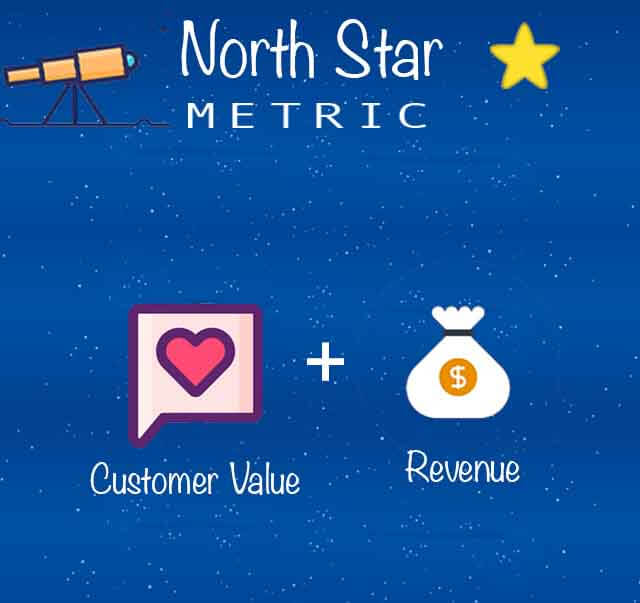
What are KPIs?
Key performance indicators (KPIs) are the numbers to evaluate the organization’s success at reaching targets. You need to set goals and benchmarks and compare the values to check if you’re progressing or not. Comparison is the crux here.
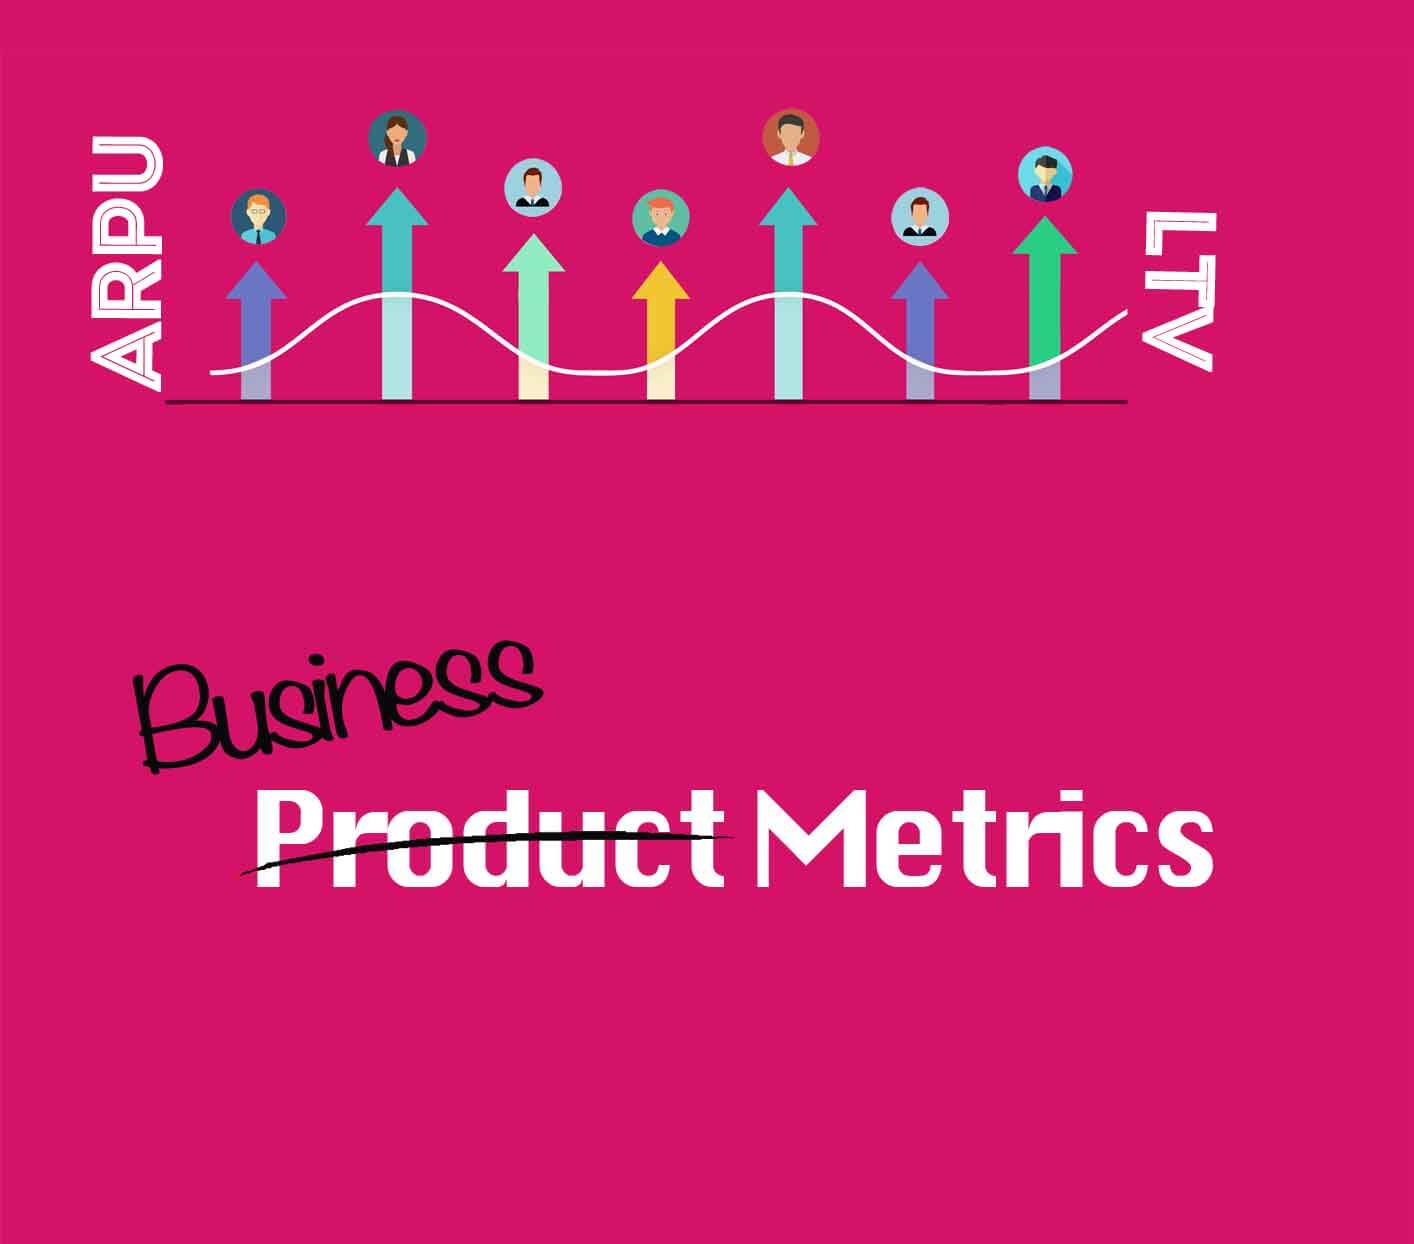
Difference between Metrics and KPIs:
Metrics are comprised of a wide range of all trackable areas. Whereas KPIs drill down into what truly matters. With metrics, think broad. With key performance indicators, think deep.
How to design Product Analytics
To deliver the stupendous product experience, we need to understand the product analytics through workflows in the product and user journey, and improvements as per the analytics’ insights.
When we design product analytics, we can think of it as
- measure events of interest,
- measure additional information about the event (where, how, how much, etc.),
- measure the information about the actor (human/machine) that triggered the event.
This is where the distinction between measurement and metrics is important – as measurement tells us about product experience, which enables us to consider the important events, hence insights and metrics.
That brings us back to our original question i.e. “What comes first – Workflows or Goals?”
Well, both have their advantages and disadvantages.
Workflow first: Advantage – Easy to identify the key events in the customer journey. Disadvantage – we might end up collecting a lot of data and forget about the goals.
Goals first:Advantage – we know the direction towards progress and benchmark to compare. Disadvantage – we might develop tunnel vision and tend to ignore other important events which can help us learn what customers actually care about.
How to choose the right metrics and set KPIs:
We would look at three metrics that are guaranteed to indicate a positive result.
- How often do users come back to engage with our product? (DAU, MAU etc)
- How much time do using spend engaging with the product? (session time, frequency of engagement etc)
- How are users progressing? (sustain the momentum)
We often make decisions under conditions of uncertainty, but uncertainty is where we find opportunity. We have to start somewhere and keep learning new insights, and set metrics accordingly. In the end, we have to ask ourselves this question – “Are we measuring to learn or measuring to control & manage?”
 Swipe for more stories
Comments